Business Request and Demand Overview
Business Request:
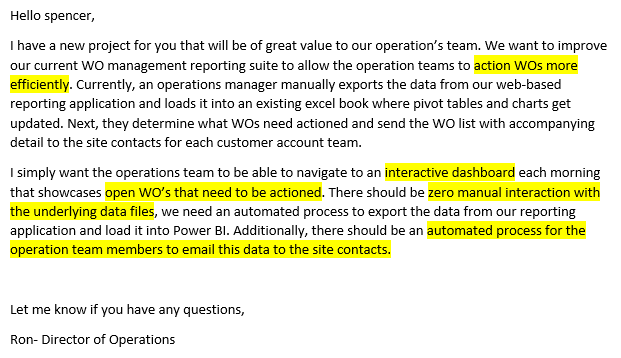
The business request for this data analyst project was an interactive WO management dashboard for the operations department. An additional request was made for an automated solution to load data from a reporting application and automatically export data from Power BI via email. Based on the request that was made the following business demand overview was created to outline project criterion.
Business Demand Overview:
- Requester: Ron– Director of Operations
- Value of Change: Interactive dashboard, automated processes, and improved WO reporting suite
- Necessary Systems: Power BI, Power Automate, SQL Data Warehouse, web-based reporting application
Project Criterion:
| No # | As a (role) | I want (request / demand) | So that I (user value) | Acceptance Criteria |
| 1 | Director of Operations | Enhance department’s WO management suite | Showcase automation tools and visualization software value | A visually impressive Power BI dashboard |
| 2 | Operations Manager | An automated process to pull data from our reporting app | No longer have to manually update reports in excel | A Power Automate flow that mimics manual process |
| 3 | Operations Member | A dashboard of open WO’s that can be sliced in a variety of ways | Can manage WO volume at scale | A Power BI dashboard which allows me to filter data by all fields |
| 4 | Site Contacts | To automatically receive WOs that require action via email | Can better track and manage current WOs specific to my customers | A Power Automate flow that can export data and send via email |
Data Preparation & Automation (Power Automate)
There are two different data sources for this project. The WO data (referred to as Fact_WO) comes from a web based reporting application which allows org. members to export data from an Oracle database. We do not have the ability to connect to this server on the back-end. Also, there is a SQL data warehouse where dimension tables are stored like DIM_Person and DIM_Geography.
We will connect directly into the SQL server for the dimension tables and write the data to Power BI. For the WO data, we will need to configure the reporting application to export the data and send it to our email every morning. (This is a common feature in such applications) Next, once we have setup a daily export from the application we can use Power Automate to save this data file to SharePoint. This will allow us to access and write this data to a Power BI Dashboard every day with zero manual interaction. The code will do it all!
The following video will showcase how to accomplish this with a scenario identical to the above.
Data Cleansing & Transformation (Power Query)
To create the necessary data model for doing analysis and fulfilling the business needs defined above I connected to our SQL Data Warehouse where the dimension tables are stored. I also connected to the SharePoint file where WO data gets exported and saved to on a recurring basis.
I decided to clean and prepare the data using the Power Query editor. Data types were changed, headers renamed, and whole columns removed based on the project criteria.
Below are the Power Query steps that I used in the back-end of Power BI to clean the data.
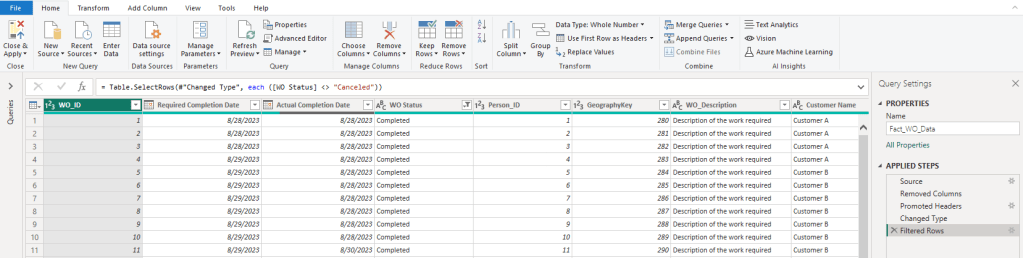
Fact_WO:
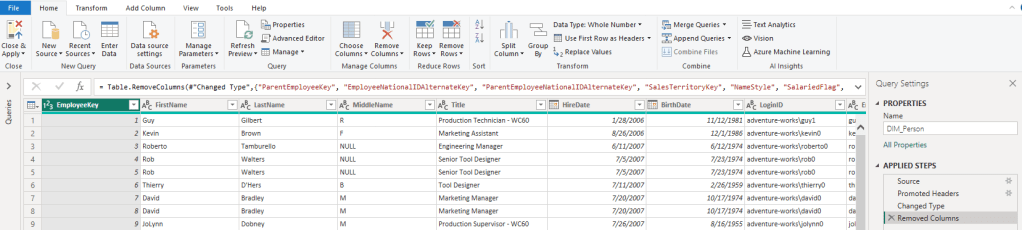
DIM_Person:
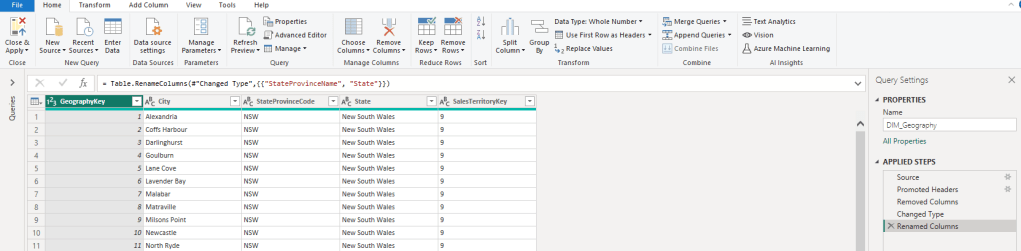
DIM_Geography:
Data Model & Dax Measures
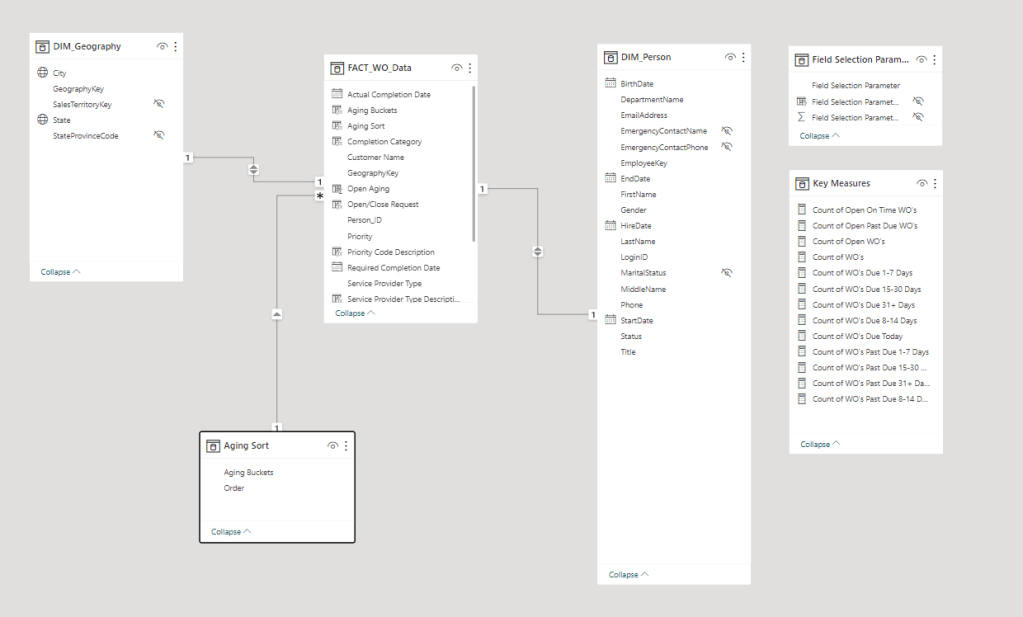
Below is a screenshot of the data model after cleansed and prepared tables were read into Power BI.
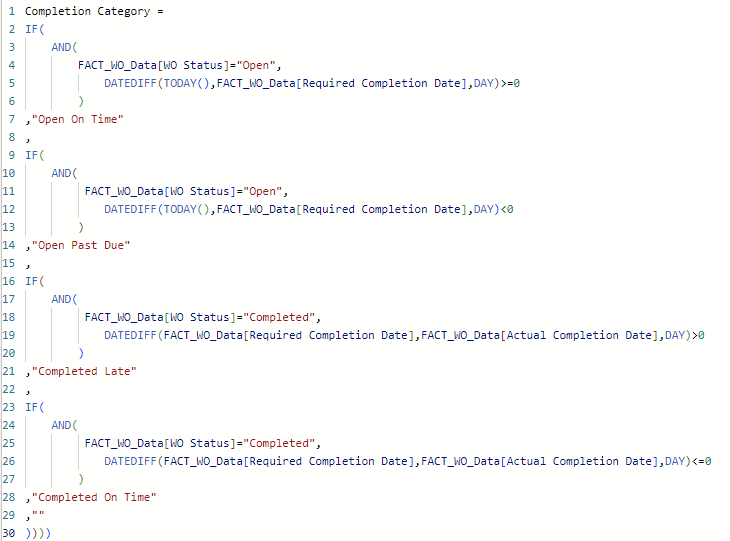
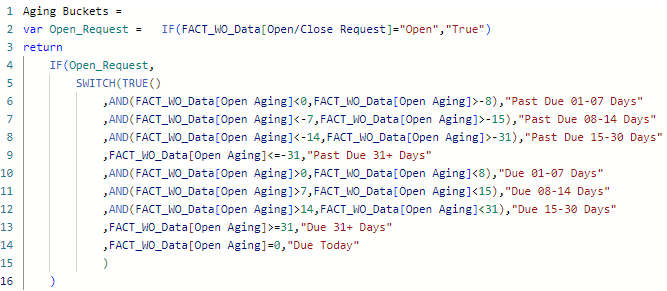
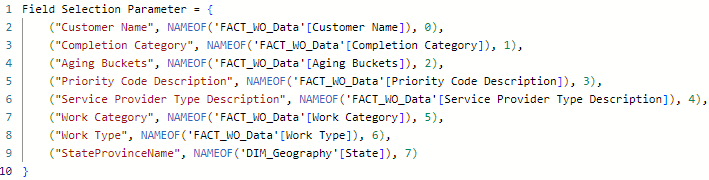
Dax Measures:
There were also a number of logic statements and calculated measures that needed to be created in order to fulfill the requirements for this project. Below are screenshots of the Dax code I developed.


Power Automate Export
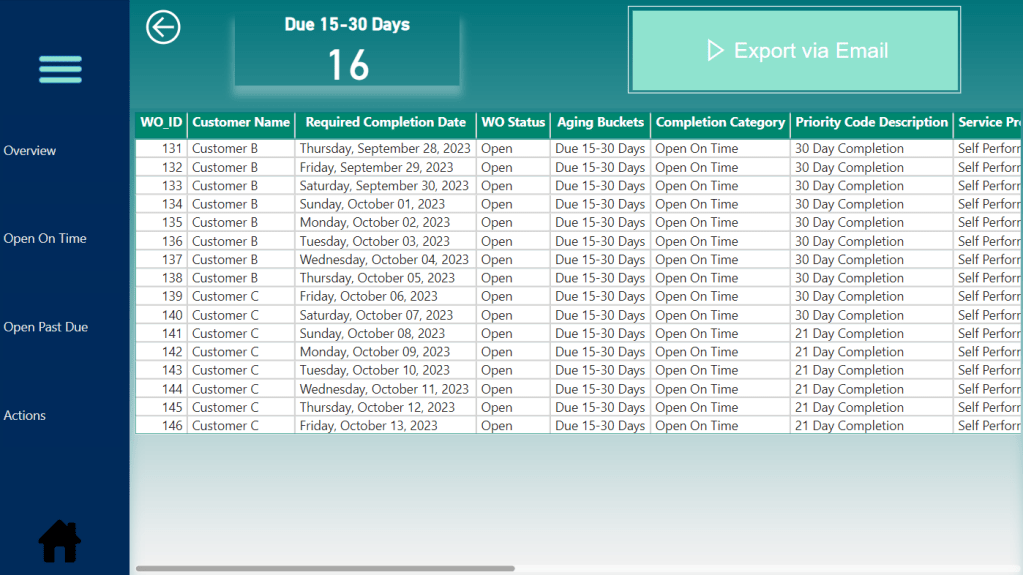
The final requirement for this project was to create a way for operation team members to automatically export data from the dashboard via email.
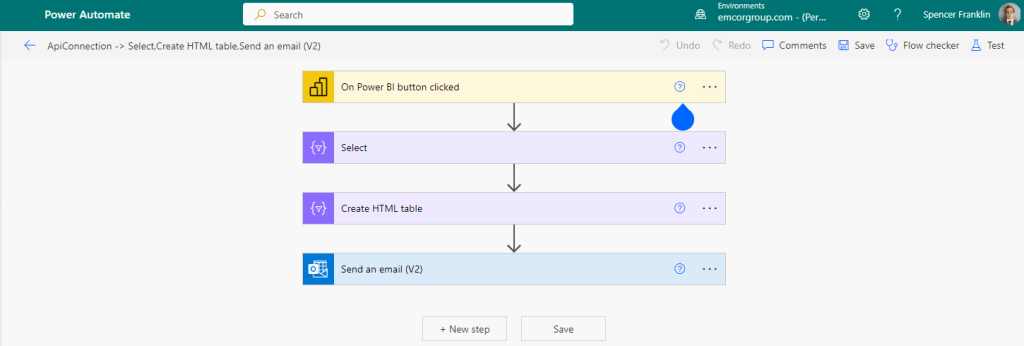
This was accomplished using a Power Automate flow that is embedded into the Power BI dashboard. The operation team members select the WOs that they want to send, click the export via email button, and then an automated email will be generated and sent to the site contacts.
Below are the screenshots of the Power Automate flow and how this would work in practice.
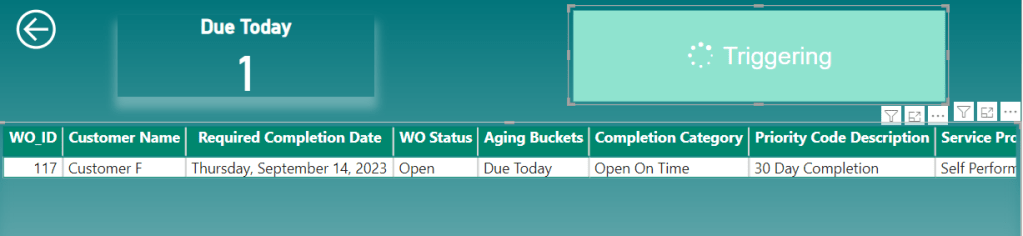
Power Automate Flow:
Flow Embedded into Dashboard – click the button to trigger the flow:
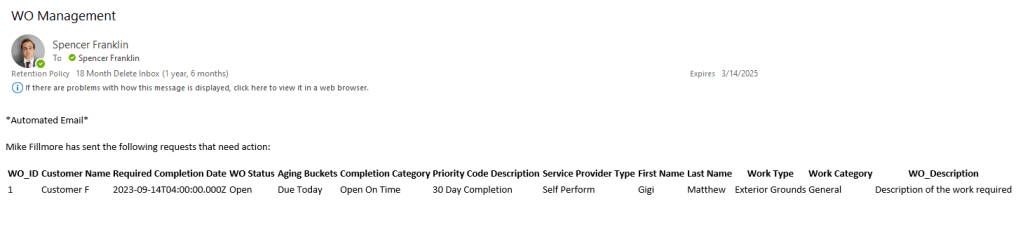
Automated Email:
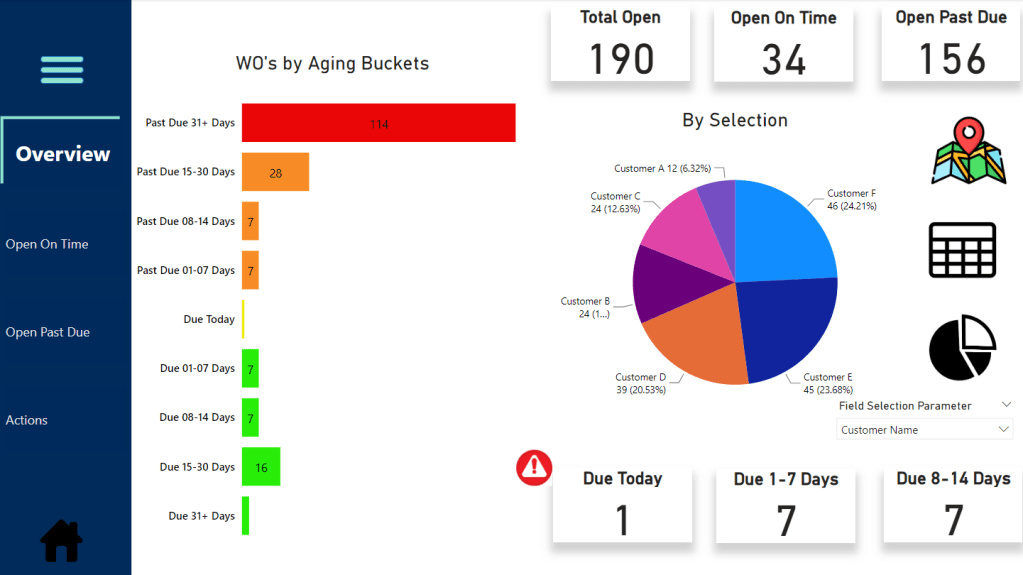
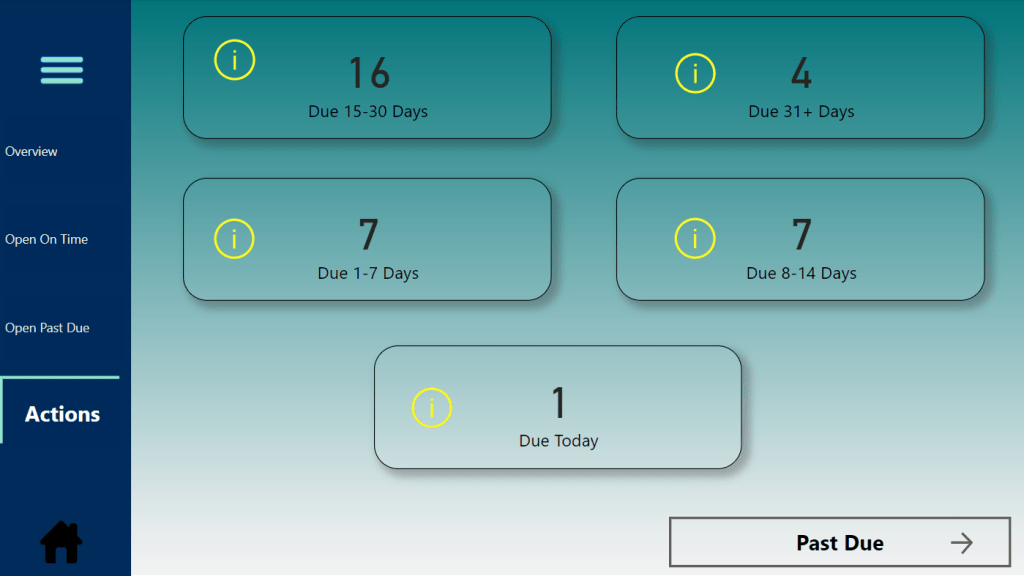
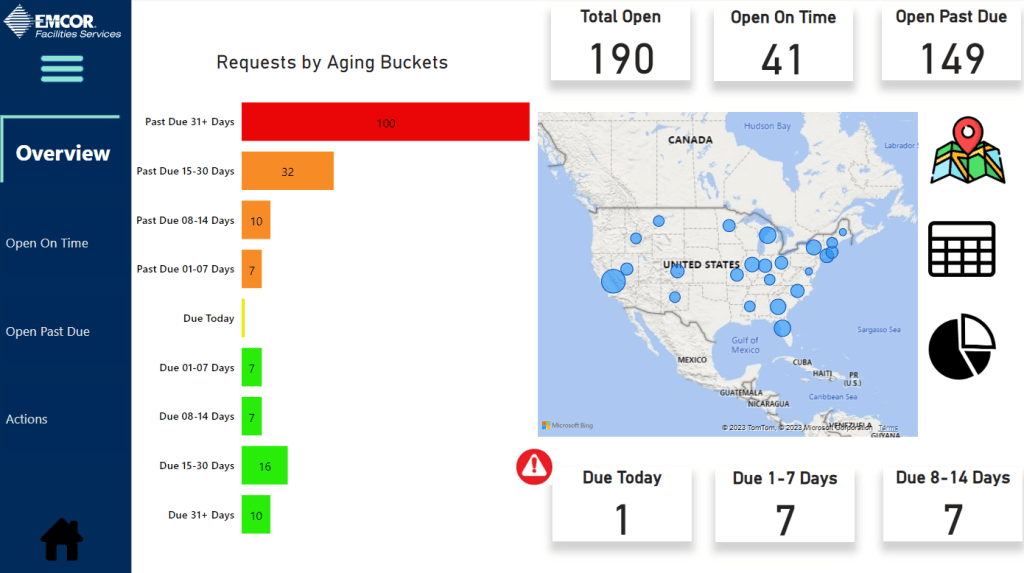
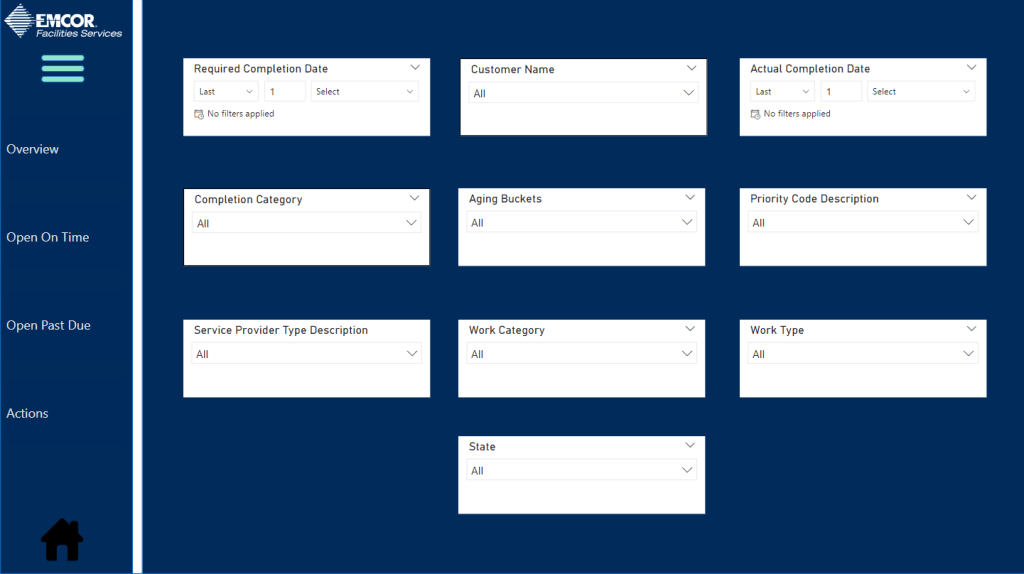
WO Management Dashboard
The finished WO Management dashboard with an overview page, Open On Time, Open Past Due, and Actions. This is an interactive dashboard that includes a dynamic navigation menu, slicer page, and icons that navigate you to different locations.


Click the image below to access the report and try it out!